The Jenkins Metrics plugin from the open source community collects various metrics about how Jenkins is performing. The CloudBees Monitoring plugin adds alerting functionality to CloudBees CI based on when metrics deviate from user-defined ranges. Define different metrics-based alerts and have CloudBees CI send emails when the alerts start and finish.
Optionally, use the Operations Center Monitoring Plugin to collect metrics from all connected controllers (remotely) and display this aggregated data in the operations center.
These instructions assume you have configured CloudBees CI with the SMTP settings required for sending emails.
The following instructions create four basic alerts:
-
An alert that triggers if any of the health reports are failing.
-
An alert that triggers if the file descriptor usage on the controller goes above 80%.
-
An alert that triggers if the JVM heap memory usage is over 80% for more than a minute.
-
An alert that triggers if the five-minute average of HTTP/404 responses goes above 10 per minute for more than five minutes.
For each alert, email notifications are sent to the Recipients configured for that specific alert, as well as the list of Global Recipients. See [Configuring global recipients] for details.
| For the alerting via email to function, CloudBees CI must be configured to be able to send emails. |
| If you prefer configuring alerts via an API, refer to Metrics API reference. |
Health reports are failing
-
Select in the upper-right corner to navigate to the Manage Jenkins page.
-
Navigate to the System page from the System Configuration section.
-
Scroll down to the Alerts section.
-
Select the Add pull-down menu for Conditions.
-
Select the Health check score option in the pull-down menu.
 Figure 1. Add health report
 -
Additional options appear. Specify the following:
-
Alert title:
Health checks -
Alert after:
5 Figure 2. Health check score alert
-
-
(Optional) Specify email recipients for this specific health check by selecting Add from the Recipients pull-down menu.
-
Save the configuration.
-
Select ! in the top right corner of the page to view Alerts.
File descriptor usage on the controller goes above 80%
-
Select in the upper-right corner to navigate to the Manage Jenkins page.
-
Navigate to the System page from the System Configuration section.
-
Scroll down to the Alerts section.
-
Select the Add pull-down menu for Conditions.
-
Select Local metric gauge within range from the pull-down menu.
-
Additional options appear. Specify the following:
-
Gauge:
vm.file.descriptor.ratio -
Alert if above:
0.8 -
Alert title:
File descriptor usage below 80% -
Alert after:
5(value is in seconds) Figure 3. File descriptor usage alert
-
-
(Optional) Specify email recipients for this specific health check by selecting Add from the Recipients pull-down menu.
-
Save the configuration.
-
Select ! in the top right corner of the page to view Alerts.
JVM heap memory usage is over 80% for more than a minute
-
Select in the upper-right corner to navigate to the Manage Jenkins page.
-
Navigate to the System page from the System Configuration section.
-
Scroll down to the Alerts section.
-
Select the Add pull-down menu for Conditions.
-
Select Local metric gauge within range from the pull-down menu.
-
Additional options appear. Specify the following:
-
Gauge:
vm.memory.heap.usage -
Alert if above:
0.8 -
Alert title:
JVM heap memory usage below 80% -
Alert after:
60(value is in seconds) Figure 4. JVM memory heap usage alert
-
-
(Optional) Specify email recipients for this specific health check by selecting Add from the Recipients pull-down menu.
-
Save the configuration.
-
Select ! in the top right corner of the page to view Alerts.
Five-minute average of HTTP/404 responses goes above 10 per minute for more than five minutes
-
Select in the upper-right corner to navigate to the Manage Jenkins page.
-
Navigate to the System page from the System Configuration section.
-
Select the Add pull-down menu for Conditions.
-
Select Local metric meter within range from the pull-down menu.
-
Additional options appear. The meter rates all report in events per second. Specify the following:
-
Meter:
http.responseCodes.badRequest -
Value:
5 minute average -
Alert if above:
0.16666666 -
Alert title:
Less than 10 bad requests per minute -
Alert after:
300(value is in seconds) Figure 5. HTTP/404 response alert
-
-
(Optional) Specify email recipients for this specific health check by selecting Add from the Recipients pull-down menu.
-
Save the configuration.
-
Select ! in the top right corner of the page to view Alerts.
 Figure 6. Alerts
Alert states
Each alert can be in one of four states:
| Icon | State | When |
|---|---|---|
|
Failing |
The alert condition is met for less than the Alert after duration |
|
Failed |
The alert condition has been met for at least the Alert after duration |
|
Recovering |
The alert condition is not met for less than the Alert after duration |
|
Recovered |
The alert condition is not met for at least the Alert after duration |
Notification emails will be sent for any alarms that are not silenced on either of the transitions:
-
Failing to Failed
-
Recovering to Recovered
The alerts are checked every 5 seconds. The Alerts page displays the
current value of each alert condition. If the condition has changed in
between these alert checks then the UI may show the alert in a mixed
state such as in An alert where the condition has changed prior to the periodic checks running.

However, once the periodic check runs, the condition will enter either the Failing or Recovering state.

If the condition changes before the condition’s Alert after time expires then no notifications will be sent.

On the other hand, if the condition stays constant for the entire Alert after time, then a notification will be sent.

Configure global recipients
You can optionally configure a list of global recipients to receive email notification of all alerts. These are in addition to email recipients specified per Alert.
-
Select in the upper-right corner to navigate to the Manage Jenkins page.
-
Navigate to the System page from the System Configuration section.
-
Scroll down to the Alerts section.
-
Select Add in the pull-down menu for Global Recipients.
-
From the Global Recipients pull-down menu, select Add.
-
Then, from the menu that appears, select the Email notifications option.
 Figure 11. Global recipients alert
 -
In the Email addresses field, specify the alert email recipients as a space or comma separated list.
 Figure 12. Alert email recipients
Silence notifications
From the Alerts page, the Silence button can be used to suppress the sending of notifications for specific alerts. The alerts are re-enabled using the Enable button.

Maintenance windows
The administrator of a CloudBees CI instance can use Jenkins CLI commands to schedule maintenance windows for that instance. During a maintenance window all alerts will effectively behave as if they were silenced, that is they will not send any notifications.
In the event that:
-
An alert is transitioning to a different state before a maintenance window starts
-
The alert state transition completes during the maintenance window
-
The alert is still in the new state when the maintenance window ends
-
The CloudBees CI instance was not restarted during the maintenance window
then the notification of that state transition will be processed after the maintenance window ends.
There are three Jenkins CLI commands available for managing scheduled maintenance windows:
- schedule-maintenance-window
-
Schedules a maintenance window.
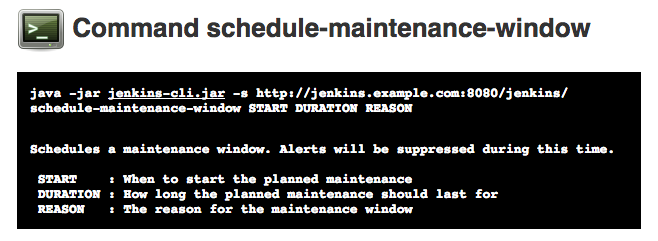
This command takes three parameters in order:
-
The start time. This is parsed using a natural language parser which accepts both dates and relative time descriptions such as:
now,tomorrow 5pm,sunday 6 in the morning,afternoon,fourteenth of june 2017 at eleven o’clock in the eveningandmidnight.The parser is based on Ruby’s chronic date parsing library. -
The duration. This is a number followed by the time units (for example,
1h,30m, or2d). -
The reason, to display in the user interface, for the maintenance window.
-
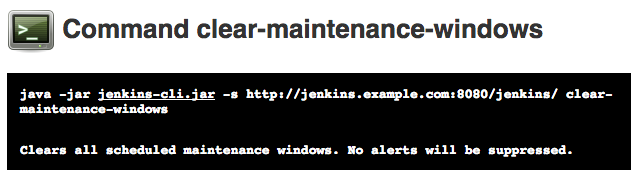
- clear-maintenance-windows
-
Removes all scheduled maintenance windows.
- complete-maintenance-windows
-
Marks all currently active maintenance windows as completed.
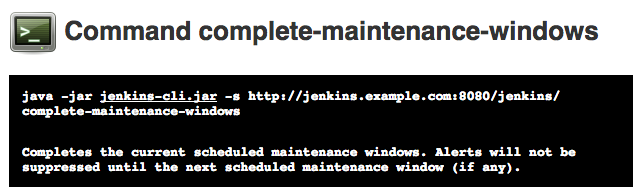
This command is typically used to mark a maintenance window as having completed early. If there are multiple overlapping maintenance windows currently active, this command will mark all of them as completed.
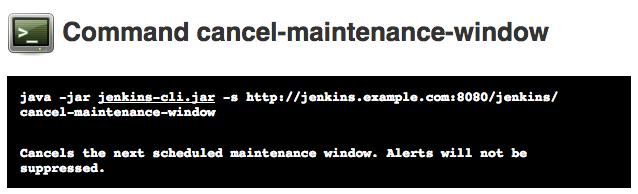
- cancel-maintenance-window
-
Cancels the next maintenance window.
- list-maintenance-windows
-
Lists the maintenance windows.
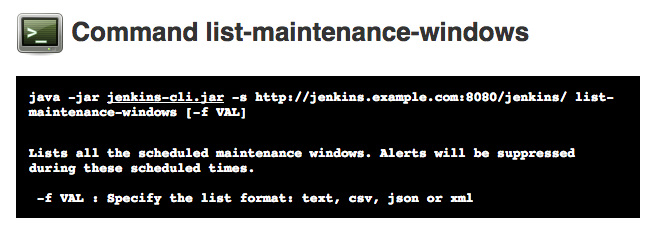
This command takes an optional --output option to specify the format to use when listing the maintenance windows.
The supported formats are: json (the default), and xml.
Maintenance window tutorial
|
This tutorial assumes that:
When the above assumptions are true, then Jenkins CLI commands can be invoked with |
First, start by checking what existing maintenance windows are scheduled using the list-maintenance-windows CLI command:
$ java -jar jenkins-cli.jar list-maintenance-windows
In this case there are no scheduled maintenance windows.
Now schedule a maintenance window for 1 day on Sunday to perform a system upgrade by using the schedule-maintenance-window CLI command:
$ java -jar jenkins-cli.jar schedule-maintenance-window sunday 1d "system upgrade"
The maintenance windows can alternatively be listed in JSON or XML format:
$ java -jar jenkins-cli.jar list-maintenance-windows --output xml <list> <window> <start>1468753200000</start> <end>1468839600000</end> <ownerId>admin</ownerId> <reason>system upgrade</reason> </window> </list> $ java -jar jenkins-cli.jar list-maintenance-windows --output json [{"start":1468753200000,"end":1468839600000,"reason":"system upgrade","ownerDisplayName":"admin"}] $
When there is at least one scheduled maintenance window, the Alerts screen will provide details of the next scheduled maintenance window.

The schedule-maintenance-window command uses a natural language parser (based on Ruby’s chronic date parser) to parse the start date.
This means that if we wanted to schedule, say a reboot of the build agents, at 5pm today, we can just use a command like:
$ java -jar jenkins-cli.jar schedule-maintenance-window "today 5pm" 30min "build agent reboot"
The third parameter of that command is the reason.
It is free-form text that informs other administrators and users about the purpose of the maintenance window.
|
| The start time had to be quoted as it contained spaces. |
You can again confirm this maintenance window with the list-maintenance-windows Jenkins CLI command:
$ java -jar jenkins-cli.jar list-maintenance-windows [{"start":1468753200000,"end":1468839600000,"reason":"build agent reboot","ownerDisplayName":"admin"},{"start":15653200000,"end":15667200000,"reason":"system upgrade","ownerDisplayName":"admin"}]
To start an unplanned maintenance window, use the start time of now:
$ java -jar jenkins-cli.jar schedule-maintenance-window now 1h "emergency plugin upgrade" $ java -jar jenkins-cli.jar list-maintenance-windows Start End Duration Owner Reason [{"start":1468653200000,"end":1468739600000,"reason":"emergency plugin upgrade","ownerDisplayName":"admin"},{"start":1468753200000,"end":1468839600000,"reason":"build agent reboot","ownerDisplayName":"admin"},{"start":15653200000,"end":15667200000,"reason":"system upgrade","ownerDisplayName":"admin"}]
When there is a maintenance window active then the Alerts screen will include a message detailing the currently active maintenance window.

| When more than one maintenance window is active at the same time, only the first window to expire will be displayed on the Alerts screen. |
If the maintenance tasks are finished early, you can mark all currently active maintenance windows as complete using the complete-maintenance-windows Jenkins CLI command:
$ java -jar jenkins-cli.jar complete-maintenance-windows $ java -jar jenkins-cli.jar list-maintenance-windows [{"start":1468753200000,"end":1468839600000,"reason":"build agent reboot","ownerDisplayName":"admin"},{"start":15653200000,"end":15667200000,"reason":"system upgrade","ownerDisplayName":"admin"}]
To cancel the next maintenance window using the cancel-maintenance-window Jenkins CLI command:
$ java -jar jenkins-cli.jar cancel-maintenance-window $ java -jar jenkins-cli.jar list-maintenance-windows [{"start":15653200000,"end":15667200000,"reason":"system upgrade","ownerDisplayName":"admin"}]
Finally, to remove all scheduled maintenance windows using the clear-maintenance-windows Jenkins CLI command:
$ java -jar jenkins-cli.jar clear-maintenance-windows $ java -jar jenkins-cli.jar list-maintenance-windows []