Leaks of Java threads and Linux kernel file handles are one of the more rare types of performance issue you may encounter with CloudBees CI. Although unusual, they can be quite difficult to diagnose when they do happen. In this document we will cover background information about how file and thread leaks occur and how to determine if you are experiencing one.
Understand types of leaks
-
File leaks
In the normal operation of most Linux processes, files on disk are created and deleted. While the process has a file open, the kernel provides a “file handle” as a reference to it. By default, most Linux systems impose limits on how many files can be open at once, at both the user and the process level. This is to prevent a rogue process from opening so many files that system performance and stability are affected. When the application fails to close files that are no longer needed, or opens huge numbers of files unnecessarily, this is called a file or file handle leak.
File leaks can sometimes be uncovered during an investigation into performance problems because large numbers of open files will start to cause noticeable slowness. Alternatively, if the open file limits on a system are set low enough, you may see a Java exception such as ‘IOException: Too many open files.’ This can happen even before there is any significant performance impact.
-
Socket leaks
In the Linux kernel, every open network socket is allocated a file handle, just like regular files. Therefore, open sockets are subject to the same configured limits as open files and also can cause the same types of problems if they are not cleaned up. It’s important to be aware of this similarity because the symptoms of file and socket leaks are similar, but at first glance you might not think to check network diagnostic tools for problems with network connection management.
-
Thread leaks
CloudBees CI is a multithreaded Java application, meaning that its single running process creates many parallel threads to accomplish work. Threads use up memory and CPU resources, so having too many of them can cause performance issues. CloudBees CI uses a modest number of long-running threads, and then many more short-lived ones that may last just for the duration of one job, one network request, etc. In some ways thread leaks belong in a separate category from file and socket leaks, but they are often connected to each other. For example, if a bug causes many network sockets to be opened and never closed, you might also see a corresponding Java thread for each of those sockets.
Diagnose file and thread leaks
Diagnosing file leaks usually requires some use of Linux CLI tools. Thread leaks can be easier to check by examining a JVM thread dump taken when the problem is occurring. You should suspect a file or thread leak if you see a “Too many open files” exception, or there is slowness without other apparent causes.
If you suspect a file or thread leak:
-
Find the process ID of the CloudBees CI java process (
pgrep javais one way to do this), and then runlsof -p $PIDas either root, or the user CloudBees CI is running as. Check for patterns where it seems like a certain type of file, such as build logs, workspace data, or Pipeline classes, are opened in large numbers. -
The File Leak Detector plugin can help identify and diagnose file leaks, but it does not show thread or socket leaks because sockets have their own file type different from regular files and the plugin ignores those.
-
The
lsofoutput also shows any potential socket leaks. These are much easier to see than file leaks because there shouldn’t ordinarily be very many sockets open. This is an example of a half-open socket:java 24896 cloudbees-jenkins-distribution *705u sock 0,8 0t0 198959439 protocol: TCPv6Whereas a normal, complete socket connection looks like this:
java 24896 cloudbees-jenkins-distribution *800u IPv6 200229180 0t0 TCP jenkinsmaster:32832->domaincontroller (ESTABLISHED)A socket connection should normally only take a few tens of milliseconds to establish, so seeing a lot of incomplete ones is definitely a sign of a leak.
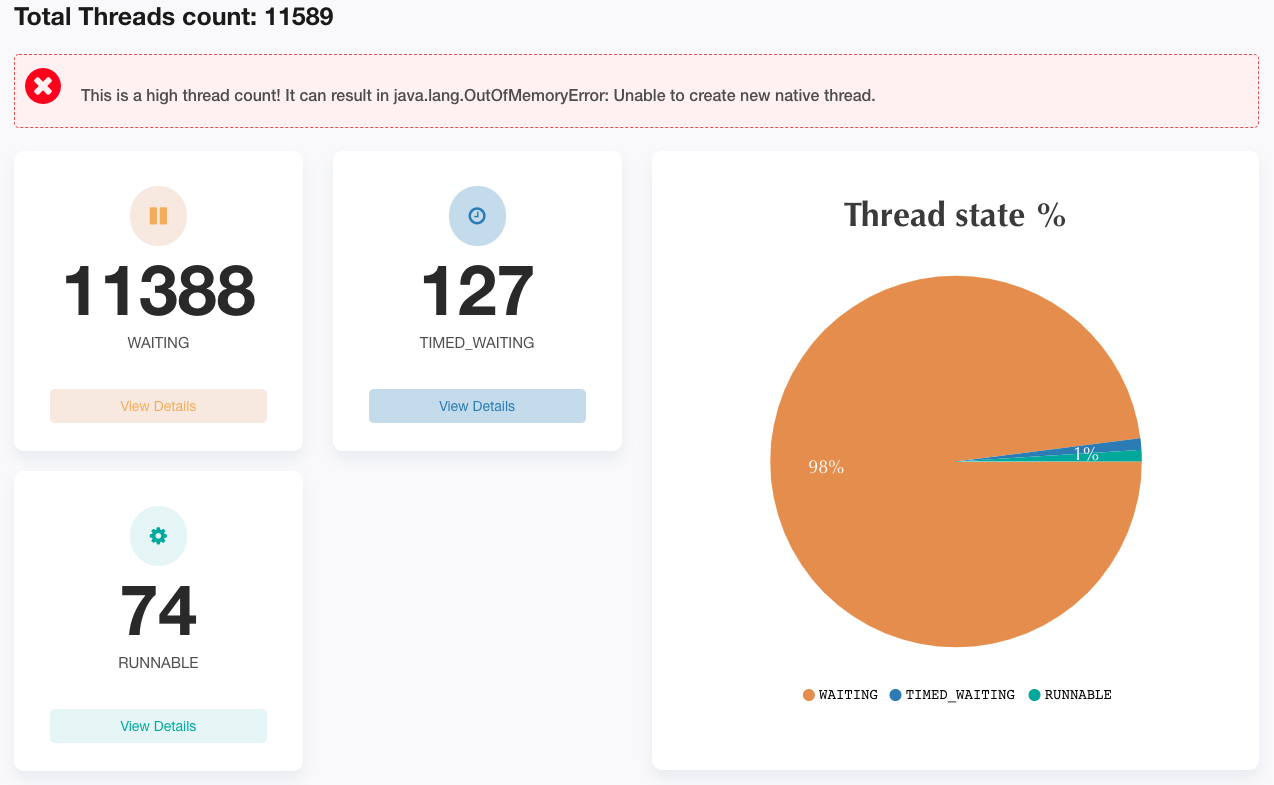
A thread leak can be seen most easily by loading a thread dump from the affected system into FastThread, a free Java thread dump analyzer. This knowledge base article explains how to capture a thread dump from a running CloudBees CI controller or operations center process. A normal controller will have anywhere from 200 to 700 threads running at any point, depending on how busy it is. When the thread dump shows thousands of threads running, that can indicate a leak (threads not completing/terminating when they should), but there can be other causes of a high thread count as well, such as high storage latency. A thread leak specifically looks like hundreds or thousands of identical threads.


How to get help with file and thread leaks
If you think your CloudBees CI environment may be experiencing a file or thread leak, please open a support case with CloudBees. Our Support team can collect necessary data from you to analyze and:
-
Check for known bugs in the versions of CloudBees CI and its plugins that you are using, which could be causing the issue.
-
Research similar reported issues that may result from configuration problems, etc.
-
Work with our Engineering team to investigate further.